
Module 5: Clustering
Clustering: An Introduction
Overview of Clustering
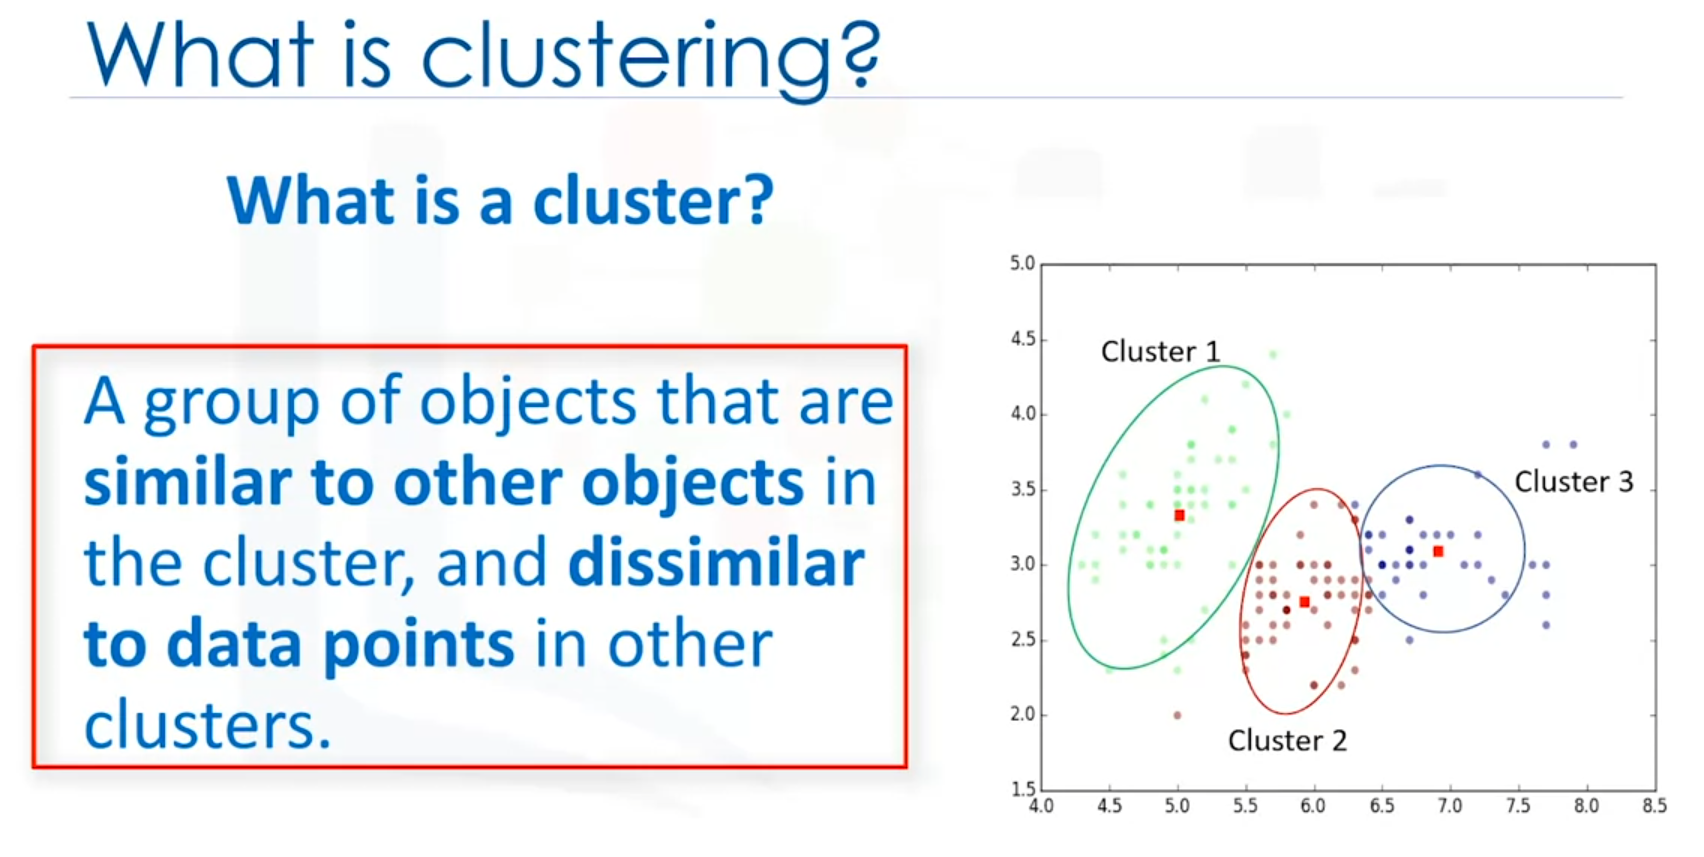
Clustering is an unsupervised learning technique used to group similar data points into clusters based on their characteristics. This method is commonly applied in various domains to segment data, identify patterns, and make predictions.
Applications of Clustering
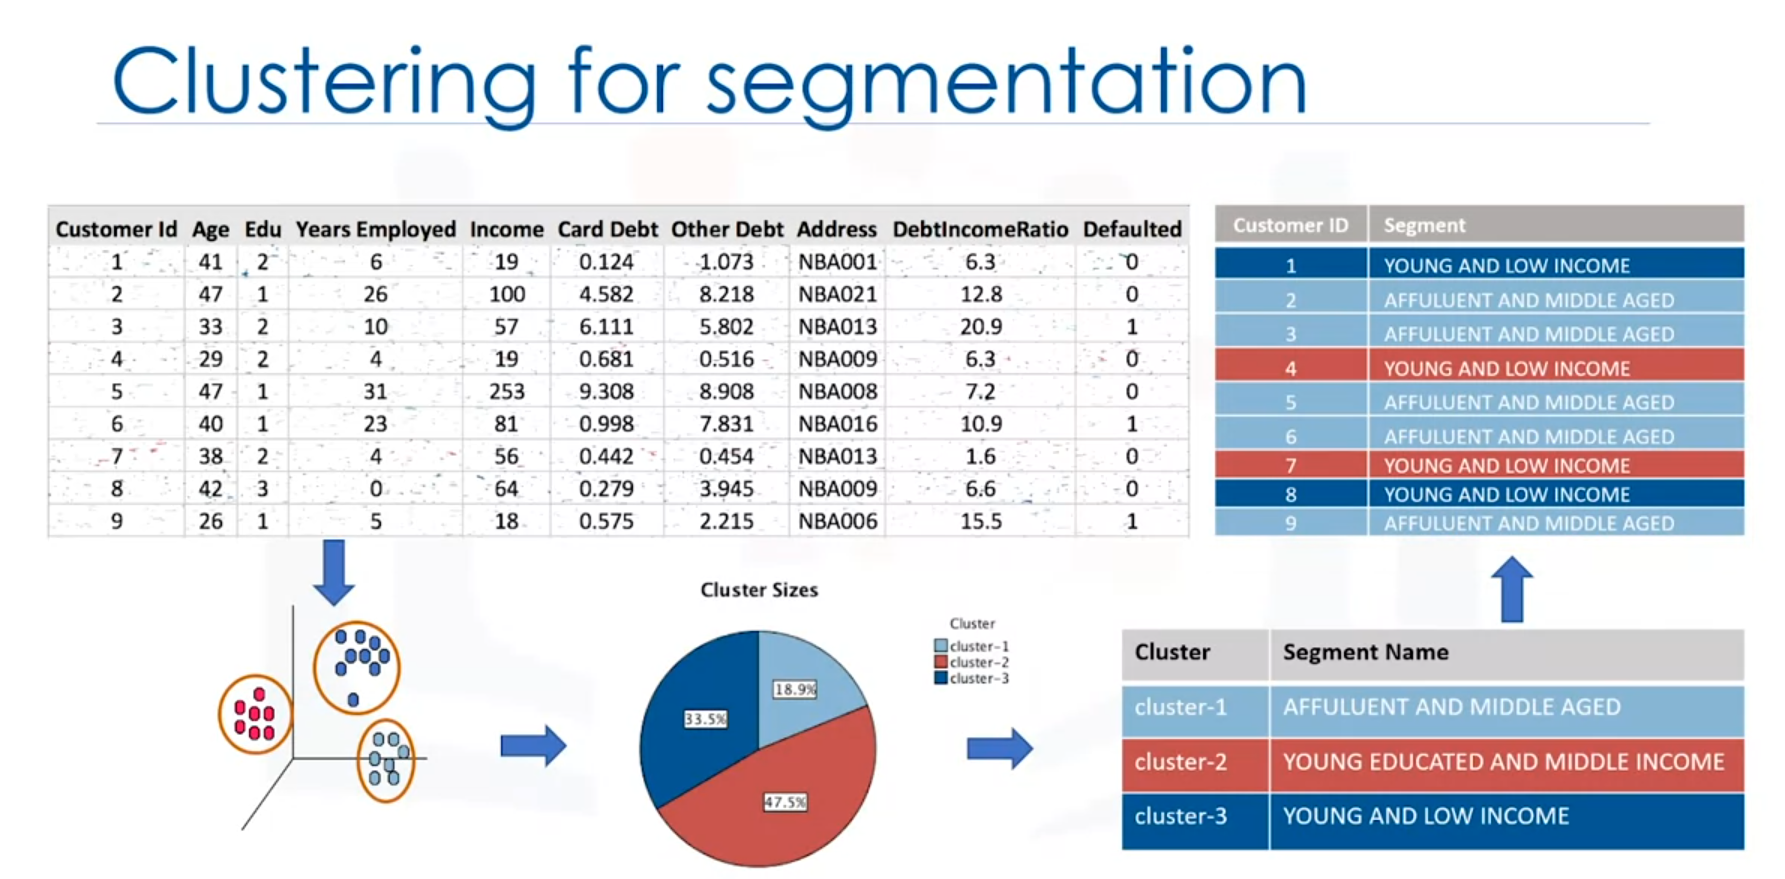
- Customer Segmentation:
- Clustering is widely used for customer segmentation in marketing. It helps businesses to group customers based on demographic or behavioral similarities, allowing for targeted marketing strategies.
- Example: Segmenting customers into groups such as high-profit low-risk, young educated, and middle-income customers.
- Recommendation Systems:
- Used to find groups of similar items or users. This information can be used for collaborative filtering to recommend products or content, such as books or movies.
- Banking:
- Clustering is used to identify normal transaction patterns, detect fraudulent credit card activities, and categorize customers based on loyalty or likelihood to churn.
- Insurance:
- Helps in fraud detection during claims analysis and evaluating insurance risks for different customer segments.
- Publication Media:
- Used to auto-categorize and tag news articles for better recommendation systems.
- Medicine:
- Clustering patients based on similar characteristics to identify effective medical therapies or grouping genes with similar expression patterns.
Clustering Algorithms
- K-Means
- K-Medians
- Fuzzy c-Means
- Agglomerative
- Divisive
- DBSCAN
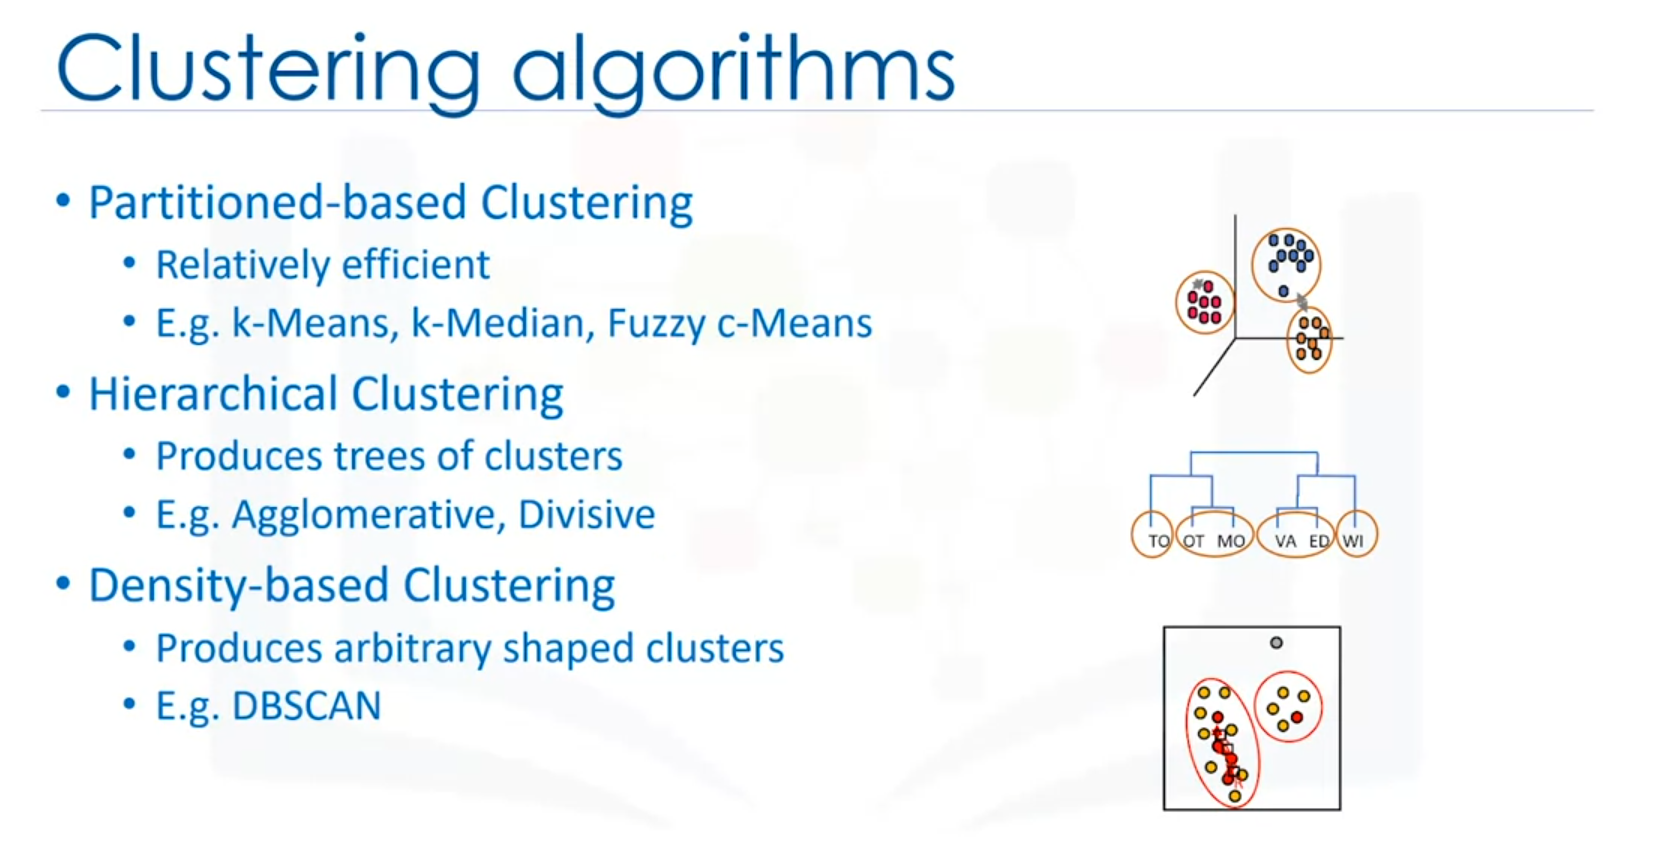
Types of Clustering Algorithms
- Partition-based Clustering:
- Algorithms such as K-Means, K-Medians, and Fuzzy c-Means produce sphere-like clusters.
- Efficient for medium to large-sized datasets.
- Hierarchical Clustering:
- Produces trees of clusters using algorithms like Agglomerative and Divisive.
- Best suited for small-sized datasets.
- Density-based Clustering:
- Creates arbitrary-shaped clusters with algorithms such as DBSCAN (Density-Based Spatial Clustering of Applications with Noise).
- Useful for spatial data or noisy datasets.
Differences Between Clustering and Classification
- Clustering:
- Unsupervised learning.
- Groups similar data points into clusters without predefined labels.
- Classification:
- Supervised learning.
- Predicts categorical labels for data points using labeled training data.
Purposes of Clustering
- Exploratory Data Analysis: To understand the structure of data.
- Summary Generation/Scale Reduction: To simplify large datasets.
- Outlier Detection: Especially useful for fraud detection or noise removal.
- Finding Duplicates: To identify and remove redundant data points.
- Pre-processing: Used as a preparatory step for other data mining tasks or predictions.
Conclusion
Clustering is a powerful technique with a wide range of applications across different industries. From customer segmentation to fraud detection, it helps in identifying patterns and making data-driven decisions. Various clustering algorithms can be chosen based on the dataset's characteristics and the specific application in mind.
K-Means Clustering
Introduction
K-Means Clustering is an unsupervised learning algorithm used for partitioning a dataset into distinct groups or clusters based on similarity. It is widely used for customer segmentation and other applications.
Key Concepts
- Customer Segmentation: Dividing a customer base into groups with similar characteristics.
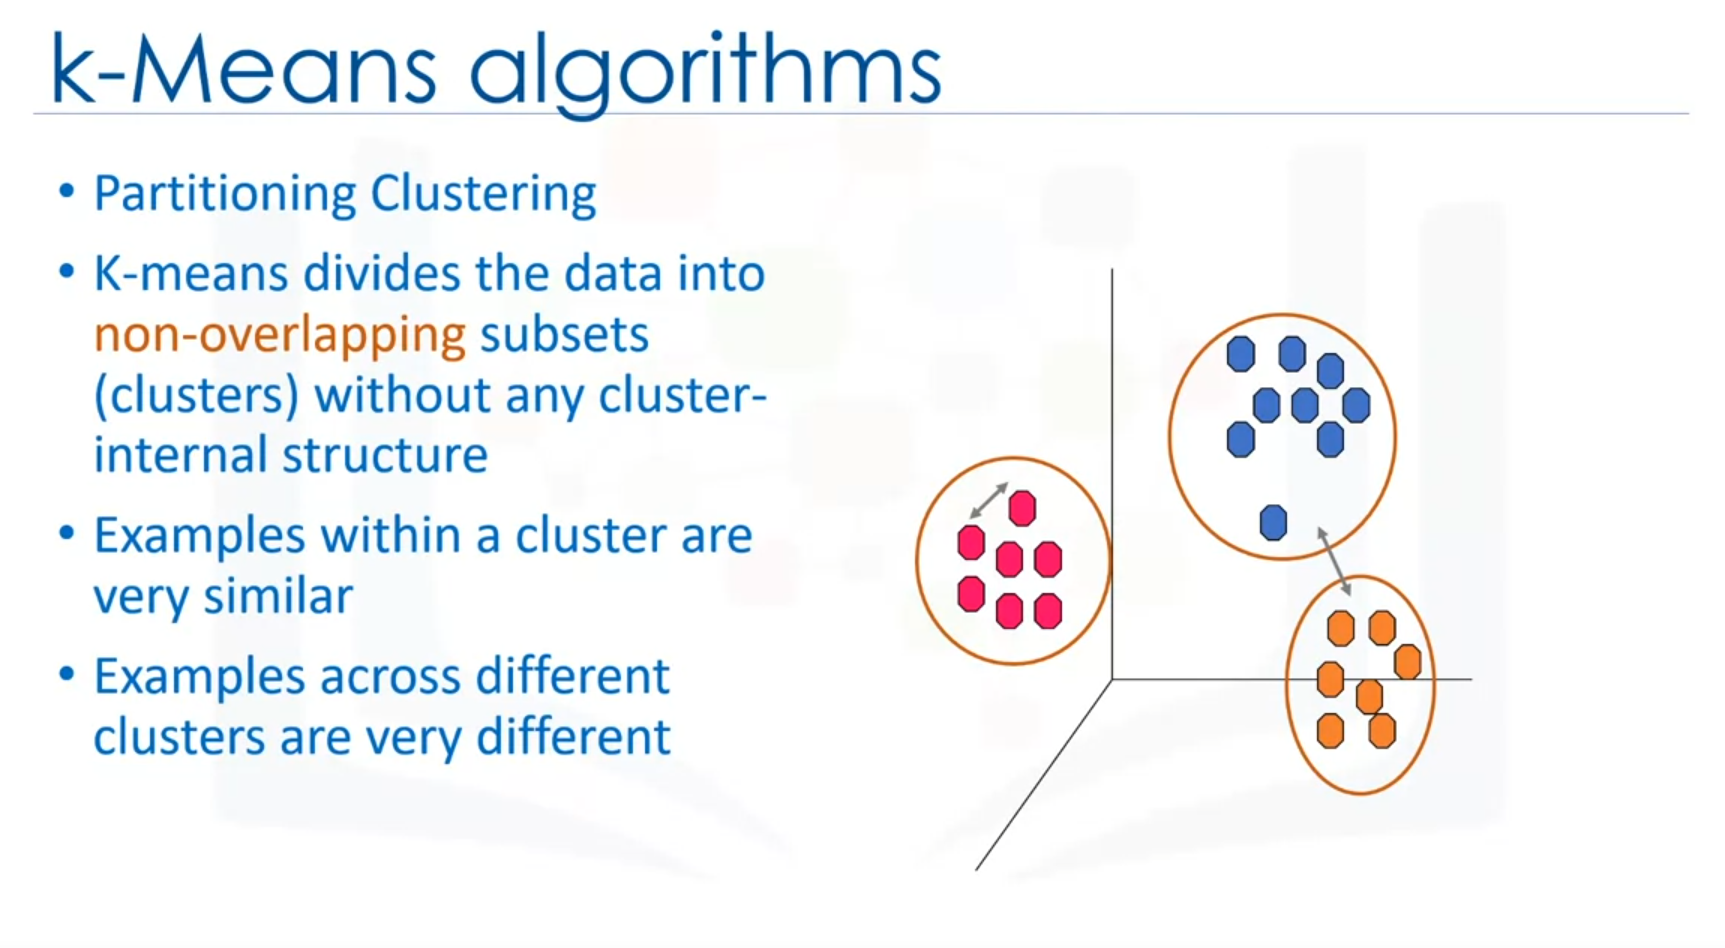
- Partitioning Clustering: K-Means is a type of partitioning clustering that divides data into K non-overlapping clusters.
Steps in K-Means Clustering
- Initialization
- Randomly select K initial centroids from the dataset or create K random points as centroids.
- Assignment
- Assign each data point to the nearest centroid based on a distance metric (e.g., Euclidean distance).
- Create a distance matrix where each row represents the distance of a data point from each centroid.
- Update
- Recalculate the centroids by taking the mean of all data points assigned to each centroid.
- Iteration
- Repeat the assignment and update steps until the centroids no longer move or the changes are minimal.
Distance Metrics
- Euclidean Distance: Commonly used to measure the distance between data points.
- Other metrics: Cosine similarity, Manhattan distance, Minkowski distance, etc., depending on the data type and domain.
Convergence
- Heuristic Algorithm: K-Means converges to a local optimum rather than a global optimum.
- Multiple Runs: To avoid local optima, the algorithm is often run multiple times with different initial centroids.
Applications
- Customer segmentation in marketing.
- Identifying buying patterns in retail.
- Fraud detection in banking.
- Categorizing news articles in media.
- Characterizing patient behavior in medicine.
Code Example
Here's a basic example of how to implement K-Means Clustering using Python's scikit-learn library:
import numpy as np
import pandas as pd
from sklearn.cluster import KMeans
from sklearn.preprocessing import StandardScaler
import matplotlib.pyplot as plt
# Sample data
data = {
'Age': [25, 30, 35, 40, 45, 50, 55, 60, 65, 70],
'Income': [40000, 45000, 50000, 55000, 60000, 65000, 70000, 75000, 80000, 85000]
}
df = pd.DataFrame(data)
# Standardize the data
scaler = StandardScaler()
scaled_df = scaler.fit_transform(df)
# K-Means Clustering
kmeans = KMeans(n_clusters=3, random_state=0).fit(scaled_df)
df['Cluster'] = kmeans.labels_
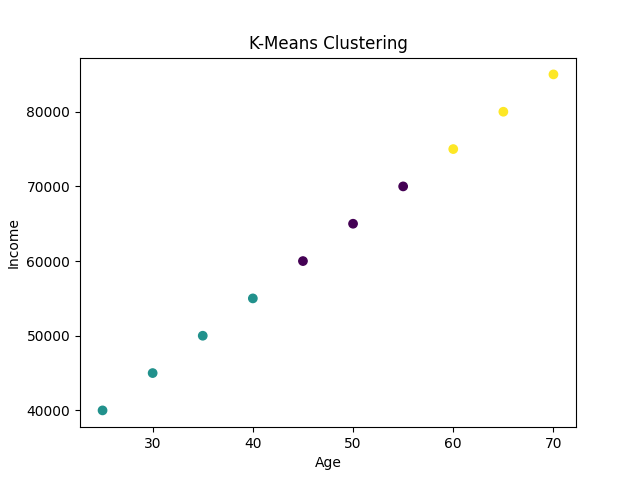
# Plotting
plt.scatter(df['Age'], df['Income'], c=df['Cluster'], cmap='viridis')
plt.xlabel('Age')
plt.ylabel('Income')
plt.title('K-Means Clustering')
plt.show()Output:
Explanation
- Import Libraries: Necessary libraries are imported.
- Sample Data: A sample dataset with 'Age' and 'Income' is created.
- Standardize Data: Features are standardized using
StandardScaler.
- Fit K-Means Model: The K-Means model is created with 3 clusters and fitted to the standardized data.
- Plot Results: A scatter plot visualizes the clustering result.
Conclusion
K-Means Clustering is a powerful tool for discovering groups within data, but its performance and results can be sensitive to the initial conditions. It is crucial to understand the dataset and choose the right distance metrics for effective clustering.
K-Means Clustering: Characteristics and Accuracy
Introduction
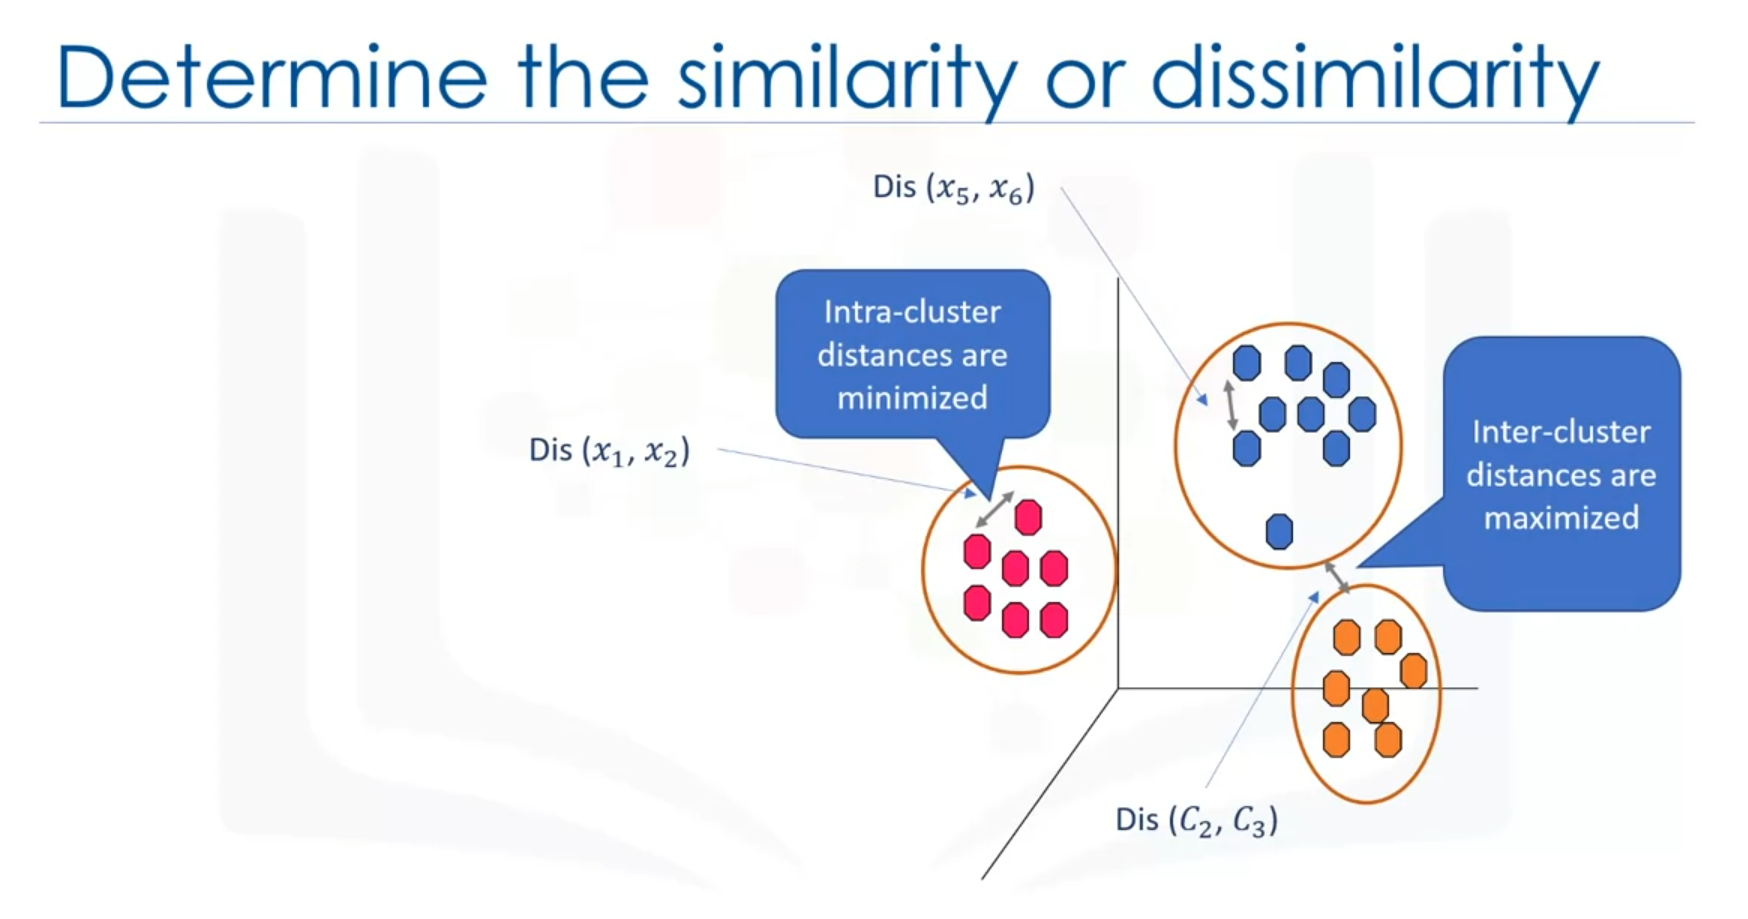
K-Means clustering is a partition-based clustering algorithm used to partition a dataset into K non-overlapping subsets or clusters. It works in an unsupervised manner, grouping data based on the similarity of samples. K-Means aims to minimize the intra-cluster variance while maximizing the inter-cluster distances.
Algorithm Overview
- Initialization:
- Randomly place K centroids, one for each cluster.
- Assignment:
- Assign each data point to the nearest centroid based on a distance metric (typically Euclidean distance).
- Update:
- Recalculate the centroids by computing the mean of all points assigned to each cluster.
- Repeat:
- Repeat the assignment and update steps until the centroids no longer move significantly.
Evaluating K-Means Clustering
Evaluating K-Means clustering is challenging, especially since it is an unsupervised learning algorithm. Common methods to assess clustering quality include:
- Within-Cluster Sum of Squares (WCSS): Measures the average distance between data points and their cluster centroids. Lower values indicate better clustering.
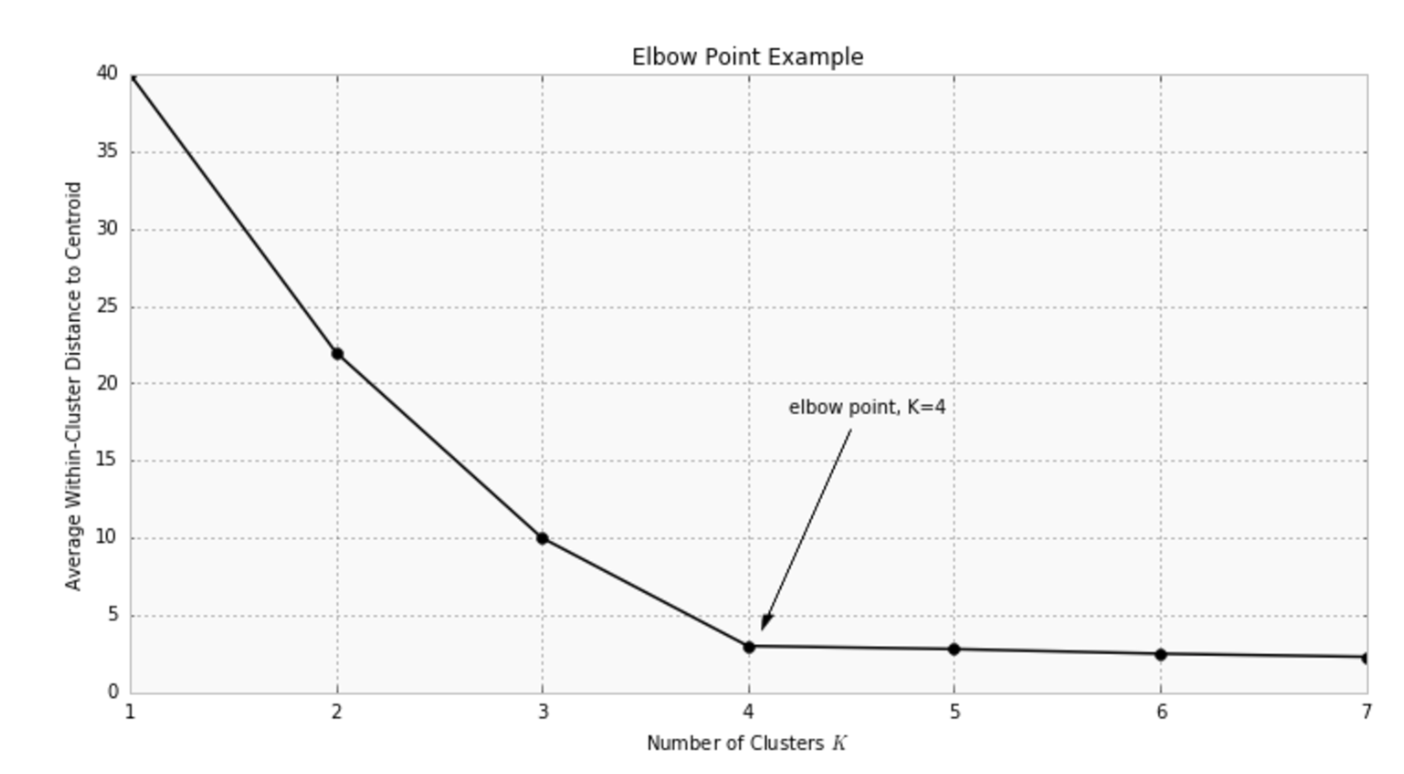
- Elbow Method: Helps determine the optimal number of clusters (K). Plot WCSS against the number of clusters and look for the "elbow" point where the rate of decrease sharply shifts.
Example Code
Below is a code example demonstrating K-Means clustering and the elbow method to find the optimal number of clusters:
import numpy as np
import matplotlib.pyplot as plt
from sklearn.cluster import KMeans
from sklearn.datasets import make_blobs
# Generate sample data
X, _ = make_blobs(n_samples=300, centers=4, cluster_std=0.60, random_state=0)
# Fit K-Means model
def find_optimal_k(X, max_k=10):
wcss = []
for k in range(1, max_k + 1):
kmeans = KMeans(n_clusters=k, init='k-means++', max_iter=300, n_init=10, random_state=0)
kmeans.fit(X)
wcss.append(kmeans.inertia_)
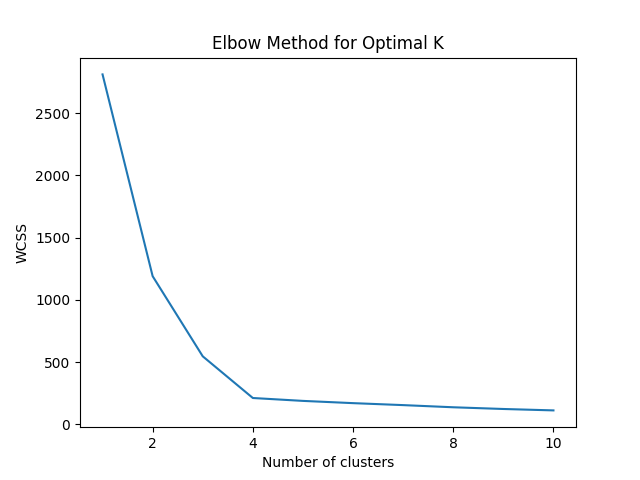
# Plot the elbow method result
plt.plot(range(1, max_k + 1), wcss)
plt.title('Elbow Method for Optimal K')
plt.xlabel('Number of clusters')
plt.ylabel('WCSS')
plt.show()
find_optimal_k(X)
# Apply K-Means with the optimal number of clusters
optimal_k = 4 # Assume the optimal K is found to be 4 from the elbow plot
kmeans = KMeans(n_clusters=optimal_k, init='k-means++', max_iter=300, n_init=10, random_state=0)
y_kmeans = kmeans.fit_predict(X)
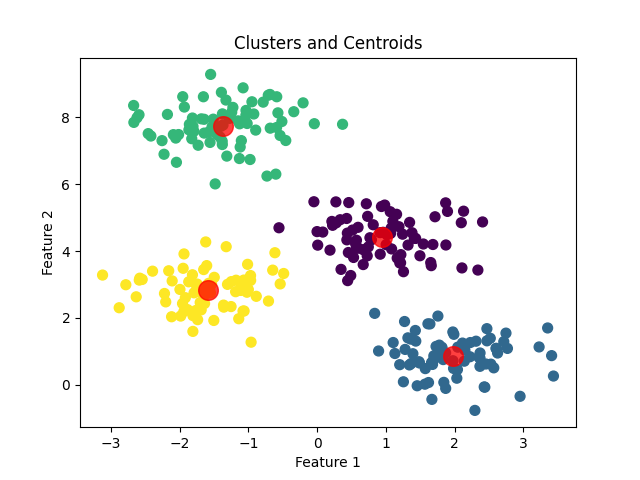
# Plot the clusters
plt.scatter(X[:, 0], X[:, 1], c=y_kmeans, s=50, cmap='viridis')
centers = kmeans.cluster_centers_
plt.scatter(centers[:, 0], centers[:, 1], c='red', s=200, alpha=0.75)
plt.title('Clusters and Centroids')
plt.xlabel('Feature 1')
plt.ylabel('Feature 2')
plt.show()Outputs:
Key Characteristics of K-Means
- Partition-Based: Divides data into K clusters based on similarity.
- Efficiency: Relatively efficient on medium and large-sized datasets.
- Cluster Shape: Produces spherical clusters as it groups data around centroids.
- Pre-Specified K: Requires the number of clusters (K) to be specified beforehand, which can be challenging.
Conclusion
K-Means clustering is a widely-used algorithm for grouping data into clusters based on feature similarity. The algorithm's effectiveness is often evaluated using metrics such as WCSS and the elbow method to determine the optimal number of clusters.